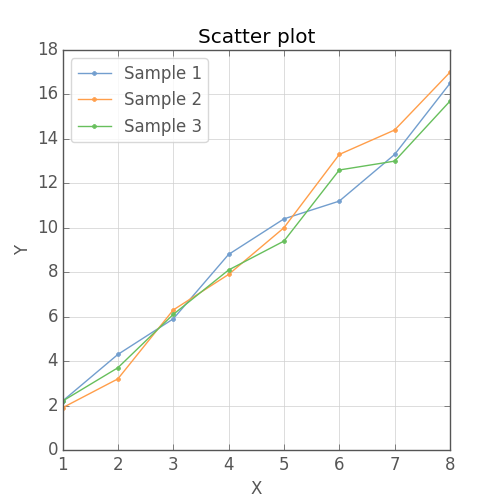
Python の matplotlib モジュールを利用して描いたグラフに対して、軸の色、座標ラベルの色や凡例の文字の色を変更したりすることができる。matplotlib.pyplot を利用して描いたグラフをカスタマイズすることで、グラフをよりきれいに見せることができる。
import matplotlib
import matplotlib.pyplot as plt


# data
x = [[1, 2, 3, 4, 5, 6, 7, 8],
     [1, 2, 3, 4, 5, 6, 7, 8],
     [1, 2, 3, 4, 5, 6, 7, 8]]
y = [[2.2, 4.3, 5.9, 8.8, 10.4, 11.2, 13.3, 16.5],
     [1.9, 3.2, 6.3, 7.9, 10.0, 13.3, 14.4, 17.0],
     [2.2, 3.7, 6.1, 8.1,  9.4, 12.6, 13.0, 15.7]]
sample_names = ['Sample 1', 'Sample 2', 'Sample 3']
cols = ['#729ECE', '#FF9E4A', '#67BF5C']

# plot
##fig = plt.figure(figsize = (5, 5), dpi = 96)
ax = fig.add_subplot(111)
for i in range(len(x)):
    ax.plot(x[i], y[i], marker = '.', linestyle = '-', color = cols[i], label = sample_names[i])


# x and y lables
ax.set_title('Scatter plot')
ax.set_xlabel('X')
ax.set_ylabel('Y')
ax.xaxis.label.set_color('#555555')
ax.yaxis.label.set_color('#555555')


# axis color
ax.spines['top'].set_color('#555555')
ax.spines['bottom'].set_color('#555555')
ax.spines['left'].set_color('#555555')
ax.spines['right'].set_color('#555555')
ax.tick_params(axis = 'x', colors ='#555555')
ax.tick_params(axis = 'y', colors = '#555555')


# legend color
axlegend = ax.legend(loc = 2, frameon = True, fontsize = 'medium', fancybox = True, numpoints = 1)
axlegend.get_frame().set_edgecolor('#CFCFCF')
axlegend.get_frame().set_alpha(0.8)
for axtext in axlegend.get_texts():
    axtext.set_color('#555555')


# grid line
ax.xaxis.grid(True, which = 'major', linestyle = '-', color = '#CFCFCF')
ax.yaxis.grid(True, which = 'major', linestyle = '-', color = '#CFCFCF')
ax.set_axisbelow(True)


##plt.savefig('pyplotlib_legend_1.png', format = 'png')
ax.xaxis.label.set_color | x 軸ラベルのテキストの色。 |
ax.yaxis.label.set_color | y 軸ラベルのテキストの色。 |
ax.spines | プロットエリアを囲む枠線の色。 |
ax.tick_params | x 座標および y 座標の目盛り。 |
ax.legend | グラフの凡例を表示。凡例エリアの枠線と透明度はそれぞれ set_edgecolor とset_alpha で指定する。また、凡例のテキストの色は get_texts により得られたオブジェクトに対して set_color を適用する。fancybox = True を指定することで、凡例エリアの枠線が丸角になる。 |
ax.yaxis.grid | y 軸に垂直なグリッドを制御するメソッド |
ax.xaxis.grid | x 軸に垂直なグリッドを制御するメソッド |
ax.set_axisbelow | True を設定すると、グラフのグリッドがプロットした点や線の下に隠れる。 |