ggplot2 のグラフの色は、色・枠線(color)と塗り(fill)で指定する。点や線などの色は、color で指定する。棒グラフやヒストグラムなどについて、枠線は color、塗りは fill で指定する。
color
プロットするデータの中に、どの列ベクトルに基づいて色を塗り分けたいかを決めて、color 引数にその列名を与える。
library(reshape2)
library(ggplot2)

df <- data.frame(
  date  = rep(1:4, times = 2),
  reps  = rep(c("A", "B"), each = 4),
  value = c(rnorm(4, 5, 1), rnorm(4, 8, 2))
)例えば、value 列の値の大小に応じて色を塗り分けたい場合は color = value を指定する。
g <- ggplot(df, aes(x = date, y = value, group = reps, color = value))
g <- g + geom_line()
plot(g)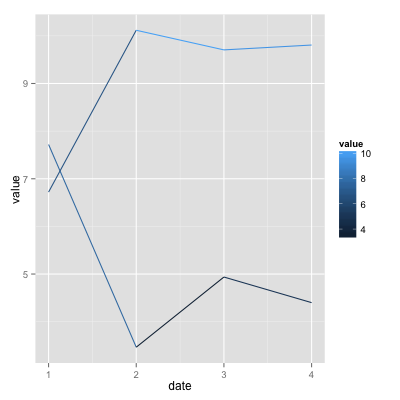
次に、color = reps と指定してみる。
g <- ggplot(df, aes(x = date, y = value, group = reps, color = reps))
g <- g + geom_line()
plot(g)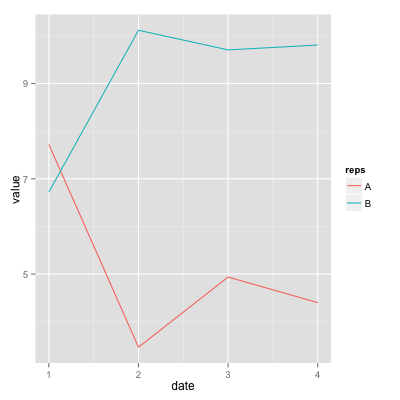
fill
fill と color を見ていくために、まずサンプルデータを作成する。
library(reshape2)
library(ggplot2)
df <- data.frame(
group = c("A", "A", "A", "B", "B", "B"),
subgroup = c("u", "v", "w", "u", "v", "w"),
value = c(1.1, 2.3, 2.1, 1.8, 2.2, 1.9)
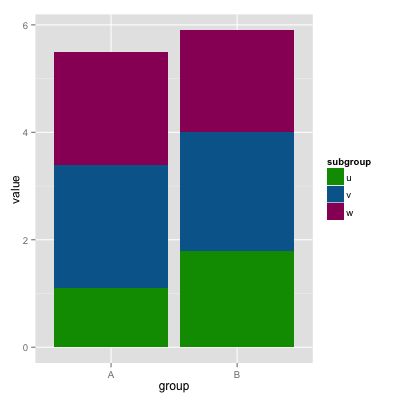
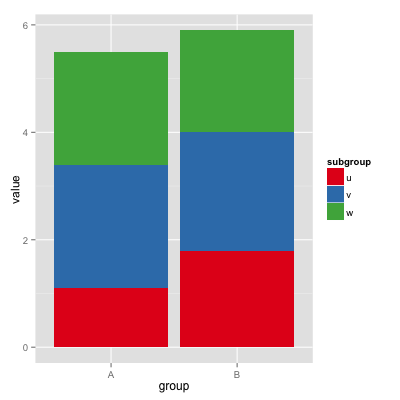
)ここで、例えば棒グラフを描くとする。このとき、subgroup ごとに色を塗り分けたければ、df 中の subgroup を fill 引数に渡す。
g <- ggplot(df, aes(x = group, y = value, fill = subgroup))
g <- g + geom_bar(stat = "identity")
plot(g)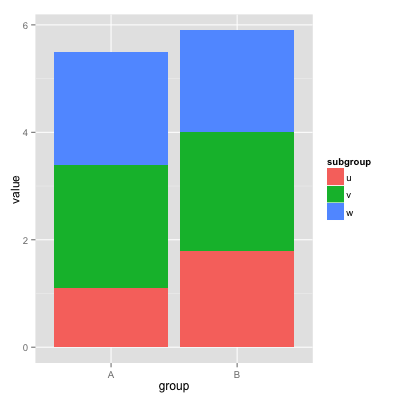
逆に、group ごとに色を塗り分けたければ fill = group とすればよい。(ただし、この例でグループごとに色を分けると、「意味のない色分け」となってしまい、読み手を混乱させる可能性がある。)
g <- ggplot(df, aes(x = group, y = value, fill = group))
g <- g + geom_bar(stat = "identity")
plot(g)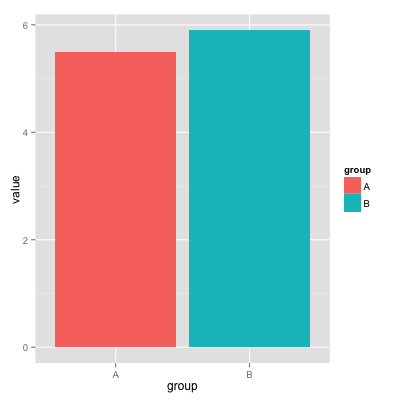
scale_color_brewer / scale_color_manual
R のパッケージの中で RColorBrewer とよばれるパッケージがあり、様々な色パレットを提供している。ggplot でこれを利用する場合は scale_color_brewer レイヤーを加える。パレットの名前は palette 引数で指定する。
library(reshape2)
library(ggplot2)

df <- data.frame(
  date  = rep(1:4, times = 2),
  reps  = rep(c("A", "B"), each = 4),
  value = c(rnorm(4, 5, 1), rnorm(4, 8, 2))
)

g <- ggplot(df, aes(x = date, y = value, group = reps, color = reps))
g <- g + geom_line()
g <- g + scale_color_brewer(palette = "Set1")
plot(g)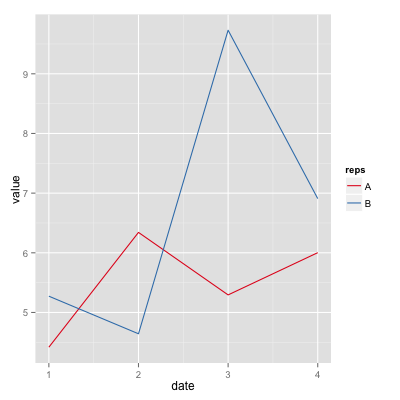
ggplot あるいは RColorBrewer が用意されたパレットを利用しないで、独自に定義した色も利用できる。この場合、scale_color_manual を利用する。
g <- ggplot(df, aes(x = date, y = value, group = reps, color = reps))
g <- g + geom_line()
g <- g + scale_color_manual(values = c("#ff9900", "#339900"))
plot(g)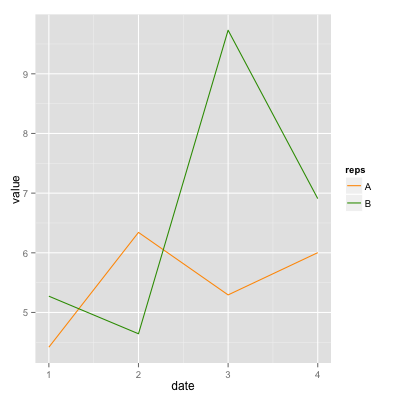
scale_fill_brewer / scale_fill_manual
R のパッケージの中で RColorBrewer とよばれるパッケージがあり、様々な色パレットを提供している。ggplot でこれを利用する場合は scale_fill_brewer レイヤーを加える。パレットの名前は palette 引数で指定する。
library(reshape2)
library(ggplot2)

df <- data.frame(
  group    = c("A", "A", "A", "B", "B", "B"),
  subgroup = c("u", "v", "w", "u", "v", "w"),
  value    = c(1.1, 2.3, 2.1, 1.8, 2.2, 1.9)
)

g <- ggplot(df, aes(x = group, y = value, fill = subgroup))
g <- g + geom_bar(stat = "identity")
g <- g + scale_fill_brewer(palette = "Set1")
plot(g)
カラーパレットを独自に定義したい場合は scale_fill_manual を用いる。
g <- ggplot(df, aes(x = group, y = value, fill = subgroup))
g <- g + geom_bar(stat = "identity")
g <- g + scale_fill_manual(values = c("#009900", "#006699", "#990066"))
plot(g)