facet_grid を利用することで、複数のグラフを一枚のプロットに表示させることができる。
サンプルデータを作成する。
library(reshape2)
library(ggplot2)
gene <- c("THC", "MAPKKKK", "GAL1", "ABA1")
time <- c("0 hr", "2 hr", "4 hr", "8 hr", "12 hr")
sampleA <- sampleB <- sampleC <- matrix(0, ncol = length(time), nrow = length(gene))
colnames(sampleA) <- colnames(sampleB) <- colnames(sampleC) <- time
rownames(sampleA) <- rownames(sampleB) <- rownames(sampleC) <- gene
for (i in 1:nrow(SampleA)) {
sampleA[i, ] <- rnorm(5, mean = c(1200, 1500, 1600, 1300, 1000), sd = 100)
sampleB[i, ] <- rnorm(5, mean = c(1200, 1500, 1600, 1300, 1000), sd = 200)
sampleC[i, ] <- rnorm(5, mean = c(1200, 1500, 1600, 1300, 1000), sd = 150)
}
sampleA
## 0 hr 2 hr 4 hr 8 hr 12 hr
## THC 1356.382 1449.591 1636.928 1351.249 1015.068
## MAPKKKK 1046.920 1455.879 1625.095 1297.037 1199.606
## GAL1 1147.616 1479.081 1500.792 1238.004 1056.606
## ABA1 1228.956 1521.725 1599.352 1254.185 1136.959
datA <- data.frame(smaple = "Sample A", melt(sampleA))
datB <- data.frame(smaple = "Sample B", melt(sampleB))
datC <- data.frame(smaple = "Sample C", melt(sampleC))
dat <- rbind(rbind(datA, datB), datC)
colnames(dat) <- c("Sample", "Gene", "Time", "FPKM")
head(dat)
## Sample Gene Time FPKM
## 1 Sample A THC 0 hr 1356.382
## 2 Sample A MAPKKKK 0 hr 1046.920
## 3 Sample A GAL1 0 hr 1147.616
## 4 Sample A ABA1 0 hr 1228.956
## 5 Sample A THC 2 hr 1449.591
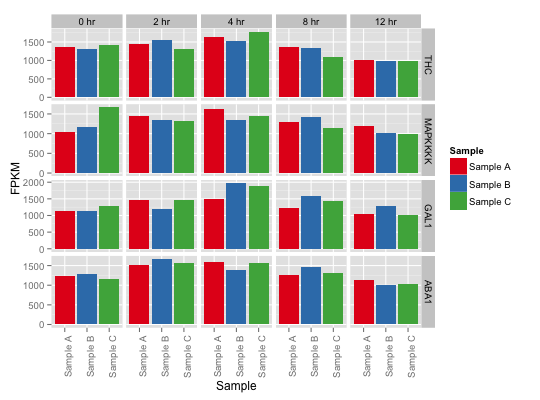
## 6 Sample A MAPKKKK 2 hr 1455.879次に ggplot を利用してグラフを描いていく。その中で、facet_grid 関数を利用して、複数のグラフをどのような順番で並べるかを指定する。例えば、グラフは行が Gene ごとに、列は Time ごとにプロットしたければ Gene ~ Time を指定する。
g <- ggplot(dat, aes(x = Sample, y = FPKM, fill = Sample))
g <- g + geom_bar(stat = "identity", postion = "dodge")
g <- g + facet_grid(Gene ~ Time, scales="free_y")
g <- g + theme(axis.text.x = element_text(angle = 90, hjust = 0.5))
g <- g + scale_fill_brewer(palette = "Set1")
plot(g)