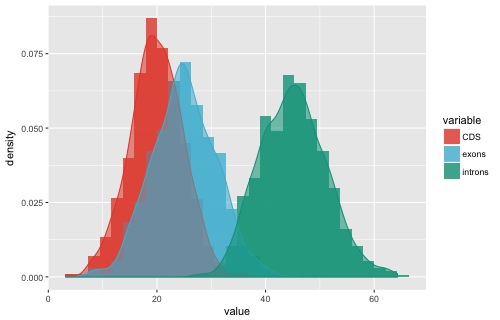
ヒストグラムは、データ分布の特徴を確認するときによく使われるグラフである。ggplot では geom_histogram 関数でヒストグラムを描くことができる。
ヒストグラム
ggplot の geom_histogram 関数を描くとき、aes 関数の x 引数に、ヒストグラムにしたいデータを指定する。
library(ggplot2)

df <- data.frame(value = rnorm(1000, 1, 1))
head(df)
##        value
## 1 -0.3904148
## 2  1.3788577
## 3  1.0617106
## 4  1.2977758
## 5 -0.8127540
## 6  1.5101867

g <- ggplot(df, aes(x = value))
g <- g + geom_histogram()
plot(g)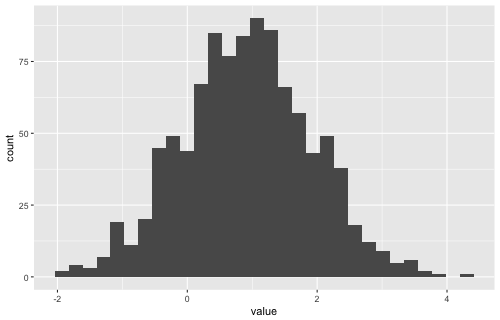
ヒストグラムの幅は、binwidth で指定できる。
g <- ggplot(df, aes(x = value))
g <- g + geom_histogram(binwidth = 0.1)
plot(g)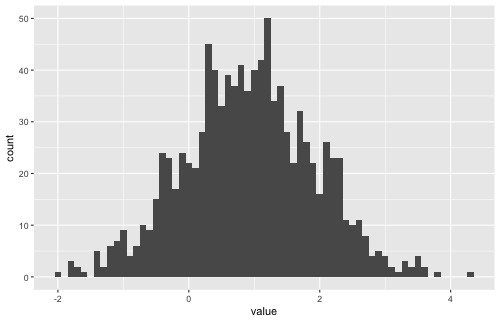
複数のヒストグラム
複数のヒストグラムを描くとき、fill 引数で塗り分けするとともに、position 引数でヒストグラムの並び方などを指定する必要がある。
library(reshape2)
library(ggplot2)
library(ggsci)

data <- data.frame(CDS = rnorm(1000, 20, 5),
                   exons = rnorm(1000, 25, 6),
                   introns = rnorm(1000, 45, 6))
head(data)
##        CDS    exons  introns
## 1 22.37381 20.78157 41.65061
## 2 24.21539 23.83124 33.92928
## 3 17.69864 21.41805 54.18681
## 4 14.51886 27.42381 36.77361
## 5 23.14270 27.32694 37.98734
## 6 20.97776 24.98222 46.58773

df <- melt(data)
head(df)
##   variable    value
## 1      CDS 22.37381
## 2      CDS 24.21539
## 3      CDS 17.69864
## 4      CDS 14.51886
## 5      CDS 23.14270
## 6      CDS 20.97776
position = "identity"
position = "identity" で指定すると、各ヒストグラムが独立に描かれる。ヒストグラムが重なって片方が見えなくなる場合があるので、ここでは色の塗りに 80% の透明度を設ける。
g <- ggplot(df, aes(x = value, fill = variable))
g <- g + geom_histogram(position = "identity", alpha = 0.8)
g <- g + scale_fill_npg()
plot(g)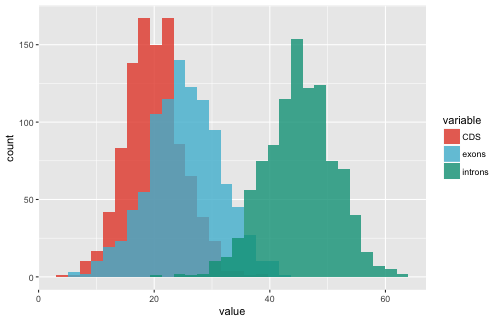
position = "dodge"
position = "dodge" で指定すると、各ヒストグラムが隣接して描かれる。
g <- ggplot(df, aes(x = value, fill = variable))
g <- g + geom_histogram(position = "dodge")
g <- g + scale_fill_npg()
plot(g)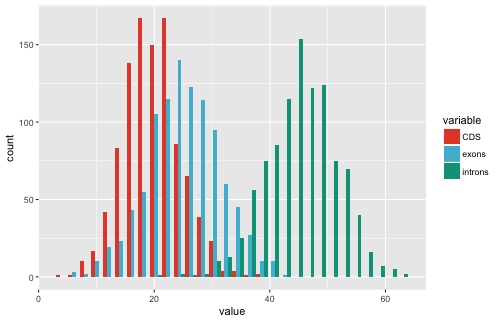
position = "stack"
position = "stack" で指定すると、各ヒストグラムが積み上げられて描かれる。
g <- ggplot(df, aes(x = value, fill = variable))
g <- g + geom_histogram(position = "stack")
g <- g + scale_fill_npg()
plot(g)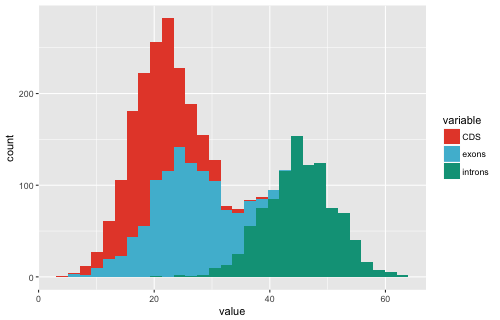
position = "fill"
position = "fill" で指定すると、各ヒストグラムの割合が描かれる。
g <- ggplot(df, aes(x = value, fill = variable))
g <- g + geom_histogram(position = "fill")
g <- g + scale_fill_npg()
plot(g)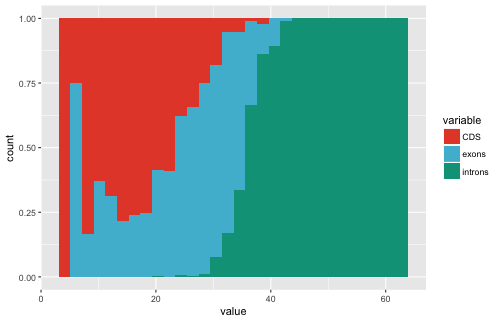
ヒストグラムと密度表示
ヒストグラムの上に、密度の推定曲線を追加で描き入れることもできる。geom_histogram ヒストグラムを描いた後に、geom_density 関数を足す。
library(reshape2)
library(ggplot2)
library(ggsci)

data <- data.frame(CDS = rnorm(1000, 20, 5),
                   exons = rnorm(1000, 25, 6),
                   introns = rnorm(1000, 45, 6))
df <- melt(data)

g <- ggplot(df, aes(x = value, y = ..density.., fill = variable))
g <- g + geom_histogram(position = "identity", alpha = 0.8)
g <- g + geom_density(aes(color = variable, alpha = 0.2), show.legend = F)
g <- g + scale_fill_npg() + scale_color_npg()
plot(g)