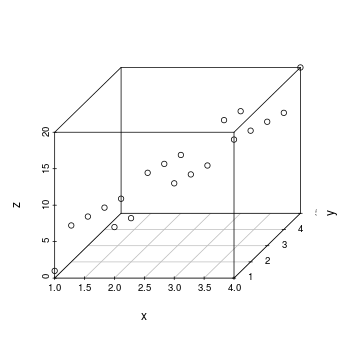
R の三次元散布図を作成する関数には、plot3d や scatterplot3d などがある。plot3d は OpenGL を利用して立体図を描くため、マウスで図を回転したり、拡大縮小したりすることができる。一方で、scatterplot3d を利用して描いた立体図は、「立体っぽく」描かれて、回転したりすることはできない。
plot3d 関数の使い方
plot3d 関数は R の rgl パッケージに含まれている。
x <- rnorm(100, 2, 10)
y <- rnorm(100, 4, 10)
z <- rnorm(100, 6, 10)

plot3d(x, y, z)
rgl パッケージをインストールする時に発生するエラー
Ubuntu で rgl パッケージをインストールするとき、X11 に関するエラーが起こる場合がある。
configure: error: X11 not found but required, configure aborted.
ERROR: configuration failed for package ‘rgl’
configure: error: missing required header GL/gl.h
ERROR: configuration failed for package ‘rgl’
このとき、mesa 関連のライブラリーを Ubuntu にインストールするとエラーがなくなる。apt-get でインストールするとき、パッケージの依存が壊れているとかのエラーが出るようであれば、apt-get を aptitude に書き換えてインストールするとうまく行く場合がある。
sudo apt-get install libgl1-mesa-dev
sudo apt-get install libgl1-mesa-swx11
sudo apt-get install libegl1-mesa
sudo apt-get install libegl1-mesa-*
sudo apt-get install libglu1-mesa
sudo apt-get install libglu1-*
sudo apt-get install libgles1
sudo apt-get install libopenvg1-mesa
sudo apt-get install libglu1-mesa-dev
scatterplot3d 関数の使い方
scatterplot3d は scatterplot3d パッケージに含まれている。
library(scatterplot3d)

x <- c(1, 2, 3, 4, 1, 2, 3, 4, 1, 2, 3, 4, 1, 2, 3, 4, 1, 2, 3, 4)
y <- c(1, 2, 3, 4, 5, 1, 2, 3, 4, 5, 1, 2, 3, 4, 5, 1, 2, 3, 4, 5)
z <- c(1, 6,11,16, 2, 7,12,17, 3, 8,13,18, 4, 9,14,19, 5,10,15,20)

scatterplot3d(x, y, z)