R で描いたグラフに軸座標を複数追加するとき、axis を利用する。
プロットの左右に y 軸を二つ付ける方法
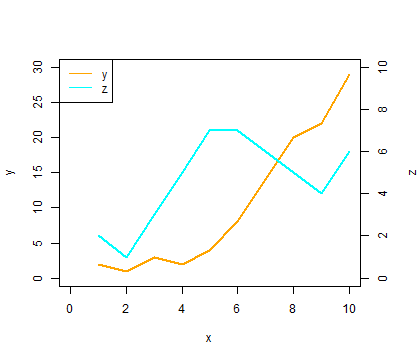
R でグラフを描くときに、plot 関数の引数を axes = FALSE と指定して、座標軸を描かずに、グラフだけを描くようにする。次に、axis 関数を 3 回利用して、x 軸を 1 つと y 軸を 2 つ描き加える。ただし、R のグラフでは右側の余白が小さく、y 軸を追加しても表示されない場合がある。その際に、par 関数の oma 引数で、右側の余白を多めに確保しておく必要がある。
x <- 1:10
y <- c(2, 1, 3, 2, 4, 8, 14, 20, 22, 29)
z <- c(2, 1, 3, 5, 7, 7, 6, 5, 4, 6)

par(oma = c(0, 0, 0, 2))

# 1st figure (x - y)
plot(x, y, xlim = c(0, 10), ylim = c(0, 30),
     xlab = "x", ylab = "y", type = "l", col = "orange", lwd = 2,
     axes = FALSE)

axis(1)   # x
axis(2)   # left y


# 2nd figure (x - z)
par(new = TRUE)
plot(x, z, xlim = c(0, 10), ylim = c(0, 10),
     xlab = "", ylab = "", type = "l", col = "cyan", lwd = 2,
     axes = FALSE)
mtext("z",side = 4, line = 3)  # right y label
axis(4)                        # right y

box()
legend("topleft", legend = c("y", "z"), col = c("orange", "cyan"), lty = 1)
プロットの左側に y 軸を二つ付ける方法
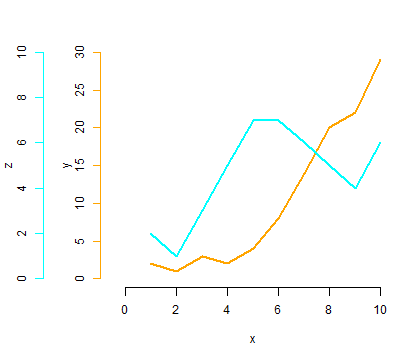
R でグラフを描くときに、plot 関数の引数を axes = FALSE と指定して、座標軸を描かずに、グラフだけを描くようにする。次に、axis 関数を 3 回利用して、x 軸を 1 つと y 軸を 2 つ描き加える。左に y 軸を 2 つ描きいれるので、par 関数の oma 引数で、左側の余白を多めに確保しておく必要がある。
x <- 1:10
y <- c(2, 1, 3, 2, 4, 8, 14, 20, 22, 29)
z <- c(2, 1, 3, 5, 7, 7, 6, 5, 4, 6)

par(mar = c(5, 8, 3, 2))

# 1st figure (x - y)
plot(x, y, xlim = c(0, 10), ylim = c(0, 30),
     xlab = "", ylab = "", type = "l", col = "orange", lwd = 2,
     axes = FALSE)
axis(1)                                            # x
mtext(1, text = "x", line = 3)                     # x label
axis(2, ylim = c(0, 30), line = 1, col = "orange") # left 1st y
mtext(2, text = "y", line = 3)                     # left 1st y label

# 2nd figure (x - z)
par(new = TRUE)
plot(x, z, xlim = c(0, 10), ylim = c(0, 10),
     xlab = "", ylab = "", type = "l", col = "cyan", lwd = 2,
     axes = FALSE)
axis(2, ylim = c(0, 10), line = 5, col = "cyan")   # left 2nd y
mtext("z",side = 2, line = 7)                      # left 2nd y label
axis 関数について
axis 関数はグラフの座標軸を描く関数である。axis(1)、axis(2) のように数字を与えて利用する。代入できる数値は 1、2、3、4 であり、それぞれ下側、左側、上側、右側の軸を意味する。
axis(1, xlim = c(0, 10))
axis(2, ylim = c(0, 100))また、axis に line オプションを描くと、軸の位置を調整することができる。この場合、mar オプションを利用して、余白を十分に取る必要がある。
par(mar = c(5, 8, 2, 2))
axis(1, line = 4)    # 下側の横軸を本来の位置から 4 文字分だけ下に描く
axis(2, line = 6)    # 左側の縦軸を本来の位置から 6 文字分だけ下に描く
軸に色を付ける場合は col 引数を利用する。
axis(1, col = "orange")
axis(2, col = "blue")