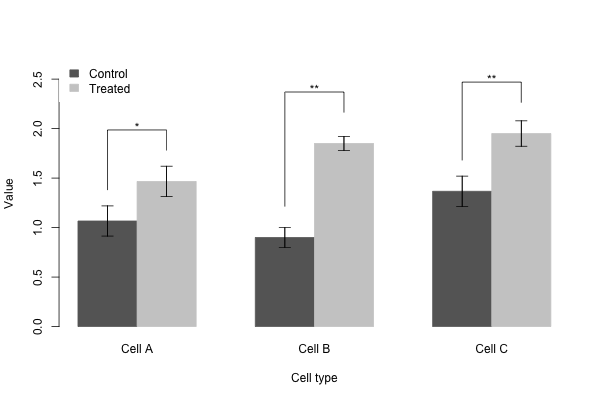
棒グラフは、種や遺伝子などのカテゴリーで分類されるデータの視覚化に利用される。例えば、処理前と処理後の遺伝子の発現量を比較しながら視覚化したいときに棒グラフを用いる。生命科学の分野において、棒グラフはエラーバーとともに用いられる場合が多い。これは生命科学の実験において、複製実験を行うのが一般的であることに由来する。複製実験で得られたデータから、平均値と標準偏差が求まる。その平均値を棒グラフの高さに、標準偏差をエラーバーとして描かれることも多い。
R では、barplot 関数を利用して棒グラフを描く。オプションなどを与えることで、積み上げ棒グラフなどを描くことができる。また、arrows 関数を利用して、棒グラフの上にエラーバーを重ね書きすることもできる。
棒グラフ
ベクトルデータ
次のサンプルコードは、ある状態下で測定された 5 つの遺伝子(a, b, c, d, e)の発現量(logFPKM)を棒グラフで描く例。まず、遺伝子の発現量をベクトル x に代入し、次に names 関数で、ベクトル x の各要素に名前をつける。
x <- c(21.3, 22.5, 34.1, 12.9, 23.1)
names(x) <- c("a", "b", "c", "d", "e")

barplot(x, xlab = "gene", ylab = "logFPKM")
棒グラフを描くとき、項目の名前が長いと、横軸に書き出される際に、左右のラベルと重なり見えにくくなる。対策方法として、横軸のラベルを縦方向にしたりする。
barplot(x, las = 2, xlab = "gene", ylab = "logFPKM")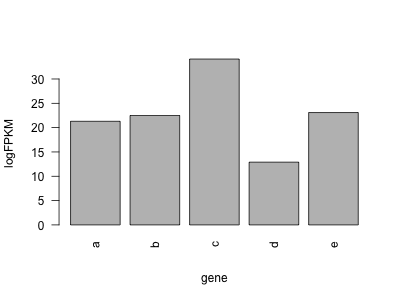
比較データ
次のサンプルコードは、処理前と処理後に測定された 5 つの遺伝子(a, b, c, d, e)の発現量(logFPKM)を棒グラフで描く例。行列を用意し、1 列目を処理前、2 列目を処理後として、また各行を遺伝子として、発現量行列を用意する。次に、行列の行と列に名前をつけて、barplot 関数で棒グラフ描く。複数項目あるので棒グラフを横に並べて描くために beside = TRUE を利用し、また、項目名も表示させるために legend = TRUE を利用する。
x <- cbind(c(21.3, 22.5, 34.1, 12.9, 23.1),
           c(25.9, 26.1, 40.2, 13.1, 22.8))
colnames(x) <- c("control", "treatment")
rownames(x) <- c("a", "b", "c", "d", "e")
x
##   control treatment
## a    21.3      25.9
## b    22.5      26.1
## c    34.1      40.2
## d    12.9      13.1
## e    23.1      22.8

barplot(x, beside = TRUE, legend = TRUE, xlab = "gene", ylab = "logFPKM")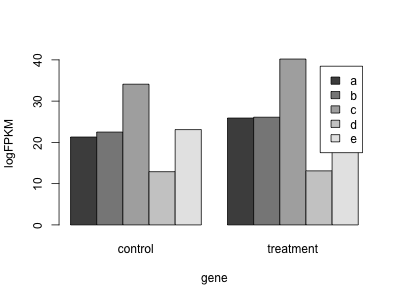
行列 x の行と列を入れ替えて(t 関数)描いた場合は、次のようになる。
barplot(t(x), beside = TRUE, legend = TRUE, xlab = "gene", ylab = "logFPKM")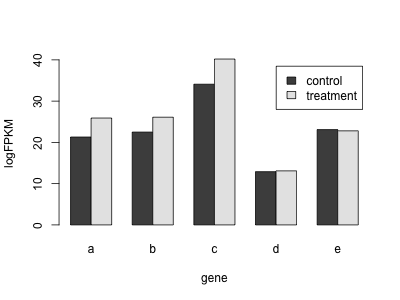
エラーバー(誤差範囲)の付け方
複製実験などが行われたときに、それらの平均値を棒グラフの高さ、標準偏差をエラーバーとして視覚化できる。棒グラフにエラーバーを付け加える場合、まず、データの平均値と標準偏差を計算してから、barplot 関数で平均値を棒グラフとして描き、その上に、arrows 関数で平均値 ± 標準偏差をエラーバーとして描く。
次のサンプルコードは、3 回の複製実験で測定した 5 つの遺伝子の発現量を棒グラフとして描いている。棒グラフを描いた後にエラーバーを描くと、縦軸の制限上、エラーバーの上半分が描かれない場合がある。これを避けるために、barplot で棒グラフを描く際に、縦軸を平均値 + 標準偏差の最大値となるように設定する(ylim = c(0, max(xm + xs)))。
x <- rbind(c(20.3, 22.5, 32.1, 12.9, 23.1),
           c(21.4, 22.1, 34.2, 13.1, 22.8),
           c(20.9, 23.3, 33.6, 12.3, 24.8))
colnames(x) <- c("a", "b", "c", "d", "e")
rownames(x) <- c("rep1", "rep2", "rep3")
x
##         a    b    c    d    e
## rep1 20.3 22.5 32.1 12.9 23.1
## rep2 21.4 22.1 34.2 13.1 22.8
## rep3 20.9 23.3 33.6 12.3 24.8


xm <- apply(x, 2, mean)
xs <- apply(x, 2, sd)

# bar chart
b <- barplot(xm, xlab = "gene", ylab = "logFPKM", ylim = c(0, max(xm + xs)))

# error bar
arrows(b, xm - xs, b, xm + xs, code = 3, lwd = 1, angle = 90, length = 0.1)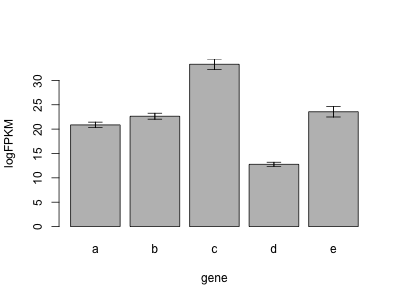
積み上げ棒グラフ
積み上げ棒グラフは、入力データとして行列を barplot に与えれば描かれる。
x <- cbind(
  c(1.0, 1.0, 1.2, 1.1),
  c(1.7, 1.5, 1.5, 1.8),
  c(2.0, 2.1, 2.2, 2.6),
  c(2.7, 3.1, 3.2, 3.1),
  c(4.2, 4.0, 4.6, 3.6)
)
colnames(x) <- c("a", "b", "c", "d", "e")
rownames(x) <- c("2016", "2017", "2018", "2019")
x
##        a   b   c   d   e
## 2016 1.0 1.7 2.0 2.7 4.2
## 2017 1.0 1.5 2.1 3.1 4.0
## 2018 1.2 1.5 2.2 3.2 4.6
## 2019 1.1 1.8 2.6 3.1 3.6

barplot(t(x), legend = TRUE)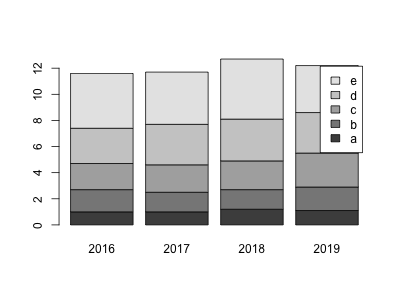
棒グラフに有意差を示すアスタリスクをつける方法
グラフを描く操作がやや複雑なために、これらの操作をまず biobarplot 関数として作る。biobarplot 関数で、まずデータの平均値と標準偏差を計算するとともに、t 検定を行う。次に、barplot で棒グラフを描き、arrows 関数でエラーバーを描く。続いて、lines 関数で比較する 2 つの棒グラフを結ぶ線を描く。最後に、t 検定の結果から、有意差があるならば、text 関数でアスタリスクをかき入れる。ここでは、グラフを描くための例を示しているが、実際のデータ解析において、t 検定を複数回を行うときに多重検定補正を行わなければならない。
biobarplot <- function(x, xlab = "", ylab = "", col = NA) {
    sample.labels <- names(x)
    condition.labels <- colnames(x[[1]])

    if (is.na(col)) {
        col <- c("#666666", "#CCCCCC")
    }

    # prepare variables to save mean, sd, and p-values
    dfm <- dfs <- matrix(0, ncol = length(condition.labels), nrow = length(sample.labels))
    colnames(dfm) <- colnames(dfs) <- condition.labels
    rownames(dfm) <- rownames(dfs) <- sample.labels
    pvalues <- rep(NA, length(sample.labels))

    # calculate mean, sd, and p-values
    for (i in seq(x)) {
        dfm[i, ] <- apply(x[[i]], 2, mean, na.rm = TRUE)
        dfs[i, ] <- apply(x[[i]], 2, sd, na.rm = TRUE)
        x1 <- x[[i]][, 1]
        x2 <- x[[i]][, 2]
        pvalues[i] <- t.test(x1[!is.na(x1)], x2[!is.na(x2)])$p.value
    }

    # change data structure
    dfm <- t(dfm)
    dfs <- t(dfs)

    # calculate the y-coordinates for plotting *
    maxy <- max(dfm + dfs) * 1.1
    stepy <- max(dfm + dfs) * 0.1

    # bar chart
    bb <- barplot(dfm, beside = TRUE, ylim = c(0, maxy + 2 * stepy), col = col, border = col, xlab = xlab, ylab = ylab)

    # error bar
    arrows(bb, dfm - dfs, bb, dfm + dfs, code = 3, lwd = 1, angle = 90, length = 0.25 / length(sample.labels))

    # write *
    for (i in 1:length(pvalues)) {
        xi <- bb[, i]
        yi <- dfm[, i] + stepy * 1.5
        maxyi <- max(yi) + stepy
        if (pvalues[i] < 0.05) {
            lines(c(xi[1], xi[1], xi[2], xi[2]), c(yi[1], maxyi, maxyi, yi[2]))
            if (pvalues[i] < 0.01) {
                text((xi[1] + xi[2]) / 2, maxyi + stepy / 4, "**")
            } else if (pvalues[i] < 0.05) {
                text((xi[1] + xi[2]) / 2, maxyi + stepy / 4, "*")
            }
        }
    }

    # graph legend
    legend("topleft", legend = condition.labels, fill = col, col = col, border = col, box.lwd = 0, box.lty = 0)
}
3 種の細胞に対して、処理前と処理後をそれぞれ 3 回の複製実験により濃度を測定したデータを例にして、棒グラフを描く。
cell.a <- data.frame(Control = c(1.1, 1.2, 0.9),
                     Treated = c(1.5, 1.6, 1.3))
cell.b <- data.frame(Control = c(1.0, 0.8, 0.9),
                     Treated = c(1.8, 1.9, NA))
cell.c <- data.frame(Control = c(1.4, 1.5, 1.2, NA),
                     Treated = c(2.1, 2.0, 1.8, 1.9))

data <- list(`Cell A` = cell.a, `Cell B` = cell.b, `Cell C` = cell.c)

biobarplot(data, xlab = "Cell type", ylab = "Value")