ビースウォームはデータを実際の点としてプロットするグラフである。統計要約量が一切描かれなく、データの分布を一目で確認できる。ビースウォームを描くには、beeswarm パッケージをインストールする必要がある。
install.packages("beeswarm", dependencies = TRUE)beeswarm の基本的な使い方
サンプルデータを利用してビースウォームを描く例。
library(beeswarm)

x <- rnorm(100, 100, 100)
y <- rnorm(100, 300, 100)
z <- rnorm(100, 500, 100)

beeswarm(list(x, y, z), labels = c("X", "Y", "Z"))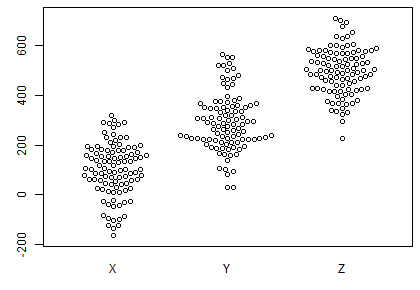
点の配置方法、色や形を変更することができる。配置方法は method で指定でき、swarm center hex と square を指定できる。
beeswarm(list(x, y, z), method = "swarm", col = c("orange", "blue", "magenta"), pch = 1, main = "swarm")

beeswarm(list(x, y, z), method = "center", col = c("orange", "blue", "magenta"), pch = 2, main = "center")

beeswarm(list(x, y, z), method = "hex", col = c("orange", "blue", "magenta"), pch = 3, main = "hex")

beeswarm(list(x, y, z), method = "square", col = c("orange", "blue", "magenta"), pch = 20, main = "square")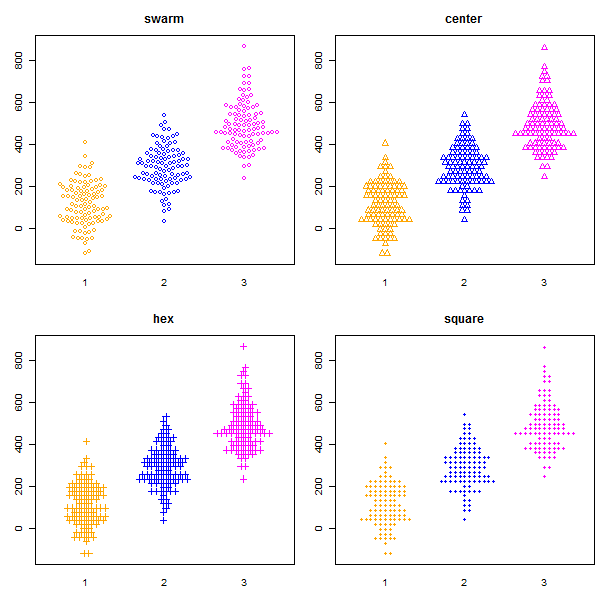
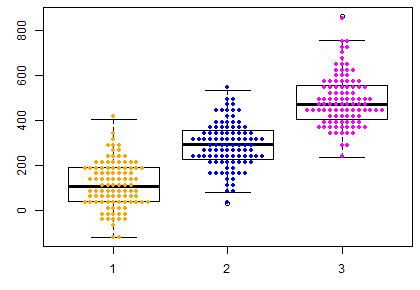
ボックスプロットに重ねる
ビースウォームをボックスプロットに重ねて描くことができる。
library(beeswarm)

x <- rnorm(100, 100, 100)
y <- rnorm(100, 300, 100)
z <- rnorm(100, 500, 100)

boxplot(x, y, z)
beeswarm(list(x, y, z),
         col = c("orange", "blue", "magenta"),
         method = "square", pch = 20,
         add = TRUE)