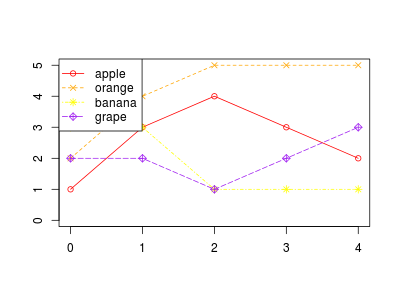
R で描いたグラフに凡例を付ける場合は legend 関数を利用する。legend の最初の 2 つの引数には、凡例の挿入位置の x 座標と y 座標を与える。座標を与える他に topleft や bottomright などを指定することもできる。
data <- data.frame(apple  = c(1, 3, 4, 3, 2),
                   orange = c(2, 4, 5, 5, 5),
                   banana = c(3, 3, 1, 1, 1),
                   grape  = c(2, 2, 1, 2, 3))

cols <- c("red", "orange", "yellow", "purple")
ltys <- c(1, 2, 4, 5)
pchs <- c(1, 4, 8, 9)

plot(0, 0, type = "n", xlim = c(0, 4), ylim = c(0, 5), xlab = "", ylab = "")
for (i in 1:ncol(data)) {
  points(0:4, data[, i], pch = pchs[i], col = cols[i])
  lines(0:4, data[, i], lty = ltys[i], col = cols[i])
}

labels <- colnames(data)
legend("topleft", legend = labels, col = cols, pch = pchs, lty = ltys)
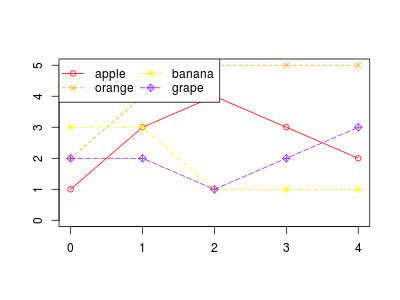
ncol 引数を利用して、凡例の並びを 2 列以上にすることができる。
legend("topleft", legend = labels, col = cols, pch = pchs, lty = ltys, ncol = 2)
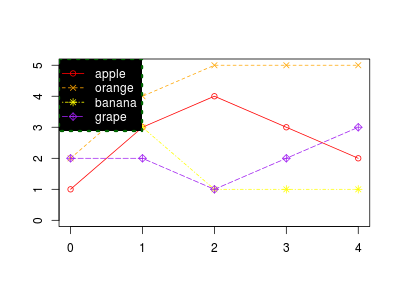
凡例を囲む枠線の種類や色を指定することもできる。
legend("topleft", legend = labels, col = cols, pch = pchs, lty = ltys,
       box.lwd = 3,             # 枠線の太さ
       box.lty = 3,             # 枠線のタイプ
       box.col = "darkgreen",   # 枠線の色
       text.col = "white",      # 凡例の文字色
       bg = "black")            # 凡例領域の背景
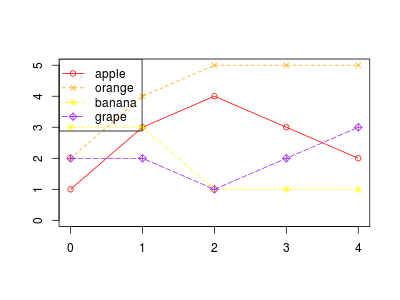
凡例を描く領域の背景を透明にすることもできる。
legend("topleft", legend = labels, col = cols, pch = pchs, lty = ltys,
       bg = "transparent")