RColorBrewer パッケージには様々な美しいカラーパレットが含まれている。RColorBrewer で提供しているカラーパレットは次のように display.brewer.all 関数で確認できる。
library(RColorBrewer)
display.brewer.all()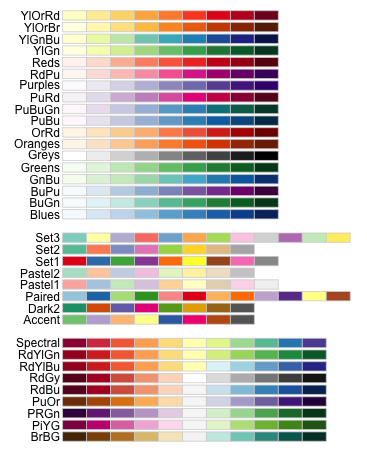
カラーパレットを利用するときは brewer.pal 関数を利用して必要なカラーパレットの名前 name とカラーの数 n を指定して取得する。
brewer.pal(n, name)折れ線グラフの例。
cols <- brewer.pal(4, "Dark2")
plot(0, 0, type = "n", xlim = c(0, 5), ylim = c(0, 5), xlab = "", ylab = "")
lines(0:5, runif(6, 0, 5), col = cols[1], lwd = 2)
lines(0:5, runif(6, 0, 5), col = cols[2], lwd = 2)
lines(0:5, runif(6, 0, 5), col = cols[3], lwd = 2)
lines(0:5, runif(6, 0, 5), col = cols[4], lwd = 2)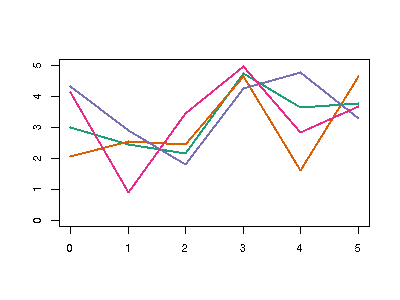
棒グラフの例。
cols <- brewer.pal(5, "Set1")
barplot(c(2, 5, 3, 4, 6), col = cols)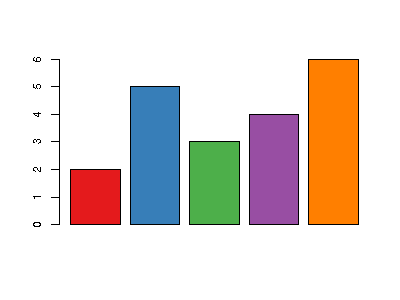
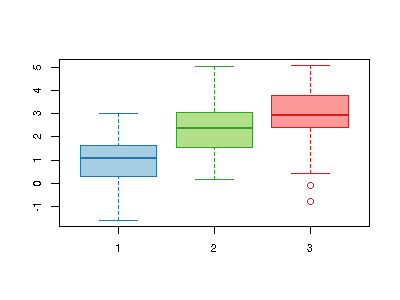
ボックスプロットの例。
cols <- brewer.pal(6, "Paired")

data <- cbind(rnorm(100, 1), rnorm(100, 2), rnorm(100,3))

boxplot(data, col = cols[c(1, 3, 5)], border = cols[c(2, 4, 6)])