R で一つの描画デバイスを複数に分割して、複数のグラフを描きいれることができる。描画デバイスの分割は mfrow または mfcol 関数を利用する。
x <- c(1, 2, 3, 4, 5)
y1 <- c(1, 1, 2, 3, 1)
y2 <- c(2, 2, 1, 2, 4)
y3 <- c(4, 3, 2, 1, 2)

par(mfrow = c(2, 2))
plot(x, y1, type = "l")
plot(x, y2, type = "l")
plot(x, y3, type = "l")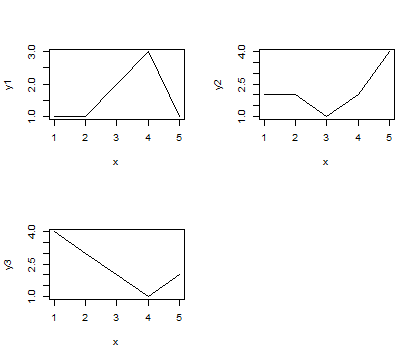
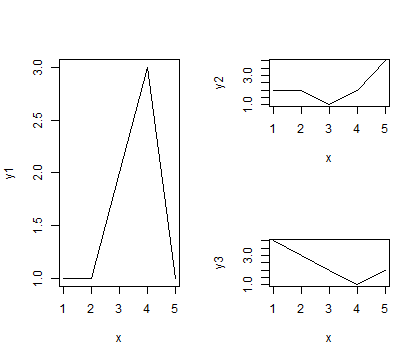
描画デバイスの分割は、split.screen 関数を利用しても行うことができる。split.screen を利用して分割した部分には、番号が振り分けられている。グラフを描くとき、その分割番号を指定してから描く。
#screen1 を 1 行 2 列に分割(左の screen1 と右の screen2 ができる)
split.screen(figs = c(1, 2))

#screen2 を 2 行 1 列に分割(上の screen3 と下の screen4 ができる)
split.screen(figs = c(2, 1), screen = 2)

screen(1)
plot(x, y1, type = "l")
screen(3)
plot(x, y2, type = "l")
screen(4)
plot(x, y3, type = "l")