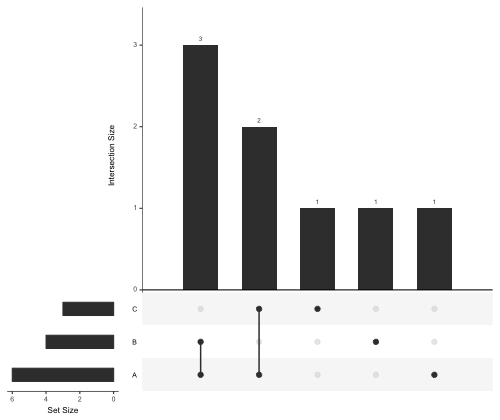
複数の集合の関係を視覚化するとき、ベン図の他に UpSet プロットで描いた方がわかりやすい場合がある。UpSet は、R の UpSetR パッケージで描くことができる(Conway et al., 2017)。
ベン図を作成するとき、各集合の要素を、リスト型で与える。
library(UpSetR)

prot1 <- c("3U5Z", "3PT6", "1MHT", "1SSO", "1H1J", "1RIY")
prot2 <- c("3U5Z", "3PT6", "1MHT", "1T2K")
prot3 <- c("1SSO", "1H1J", "2KI2")
data <- list(A = prot1, B = prot2, C = prot3)

upset(fromList(data), order.by = "freq")
References
- UpSetR: an R package for the visualization of intersecting sets and their properties. Bioinformatics. 2017, 33(18):2938-2940. DOI: 10.1093/bioinformatics/btx364 PMID: 28645171